Netdata is a robust and versatile monitoring tool that provides a deep dive into the important metrics of your Kubernetes cluster, including CPU utilization, memory consumption, disk I/O, network traffic, and even individual application performance. You can easily monitor your cluster in real-time with Netdata thanks to its user-friendly interface, which also clearly explains its health. Netdata is an open-source solution that is transparent and publicly available without the need for an account. In order to help you keep ahead of potential problems in your cluster, Netdata delivers machine learning-powered anomaly detection, which proactively discovers deviations from expected behavior.
What distinguishes Netdata is its simple installation and setup process; Netdata requires only a few lines of commands to get it up and running in your Civo Kubernetes cluster. Netdata provides essential metrics, intelligent graphs, and timely warnings in addition to acting as a graphing solution and all-inclusive monitoring tool. The Netdata auto-discovery feature provides intelligent monitoring and profiling for numerous important factors. Netdata excels in offering a comprehensive perspective of system health, whether it's monitoring disk utilization, virtualization servers, Kubernetes metrics, or web servers.
This tutorial offers installation instructions to deploy Netdata on the Civo Kubernetes cluster and explores the benefits when utilizing Netdata for effectively monitoring Civo Kubernetes workloads.
Prerequisites
Before we begin, there are some prerequisites you’ll need to have in place:
Installing Netdata
There are 2 options to install Netdata on your Civo Kubernetes cluster:
- Civo Marketplace UI
- Civo CLI
Civo Marketplace UI
To install Netdata on Civo Marketplace, follow these steps:
Step 1: After you have launched your Kubernetes cluster, go to the "Kubernetes" section in your Civo dashboard and choose the specific Kubernetes cluster where you wish to deploy Netdata.

Step 2: In your chosen cluster's dashboard, locate the "Marketplace" section. Within the marketplace, navigate to the "Monitoring" category. From here, find and select the "Netdata" option. To start the installation process, click on "Install Apps."
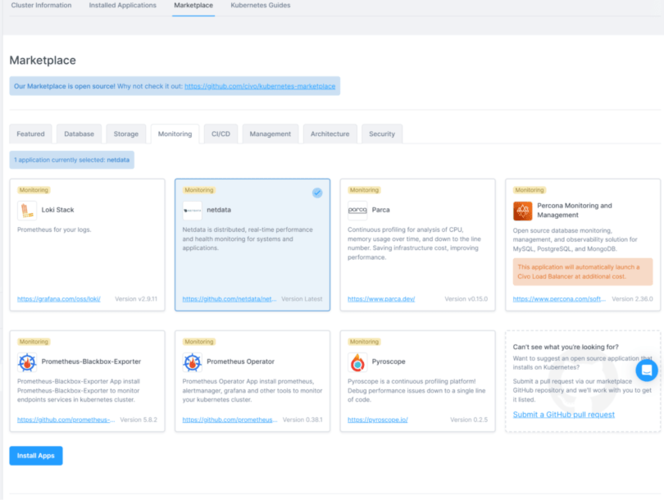
Step 3: Upon successful initiation, you should see a confirmation message or progress indicator. Ensure that the installation is completed without any errors.
Civo CLI
To install Netdata through the Civo CLI, use the following command:
civo kubernetes applications add netdata --cluster Use the actual name of your Kubernetes cluster in place of CLUSTER-NAME. If there is no error during installation, the Netdata application will be successfully installed into the Kubernetes cluster, and you'll get this result:
The application was installed in the Kubernetes cluster Accessing the Netdata Dashboard
Netdata is made accessible in your Kubernetes cluster via a service using a mechanism called "NodePort." A NodePort service is a type of service that opens a specific port on all nodes and redirects traffic on that port to the service.
Once you've deployed Netdata in your Kubernetes cluster, you can easily access its Dashboard via these steps:
Step 1: Start by logging into your Civo dashboard and accessing you installed applications by going to "Kubernetes" > "Kubernetes Cluster" > "Installed Applications."
Step 2: Within the list of installed applications, locate and select the Netdata application.
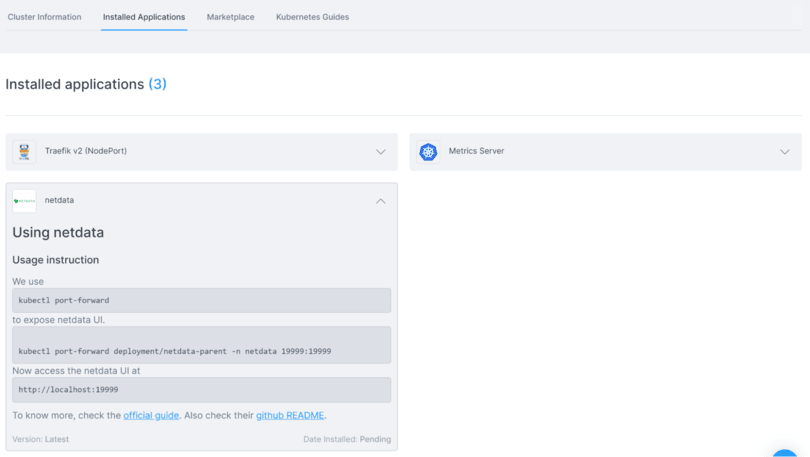
Step 3: Upon selecting Netdata, you'll find usage instructions guiding you on how to access the dashboard. Follow the provided “Usage instruction” and access the Netdata Dashboard at http://localhost:19999.
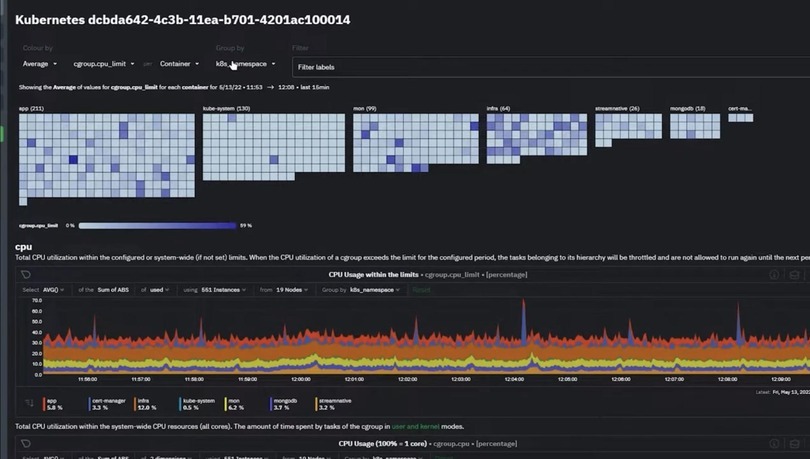
Overview of Netdata
The Netdata Dashboard UI comprises various sections, each offering unique insights and functionalities for monitoring your Kubernetes cluster performance. Let's explore the different sections of the Netdata Dashboard UI in detail:
User Interface
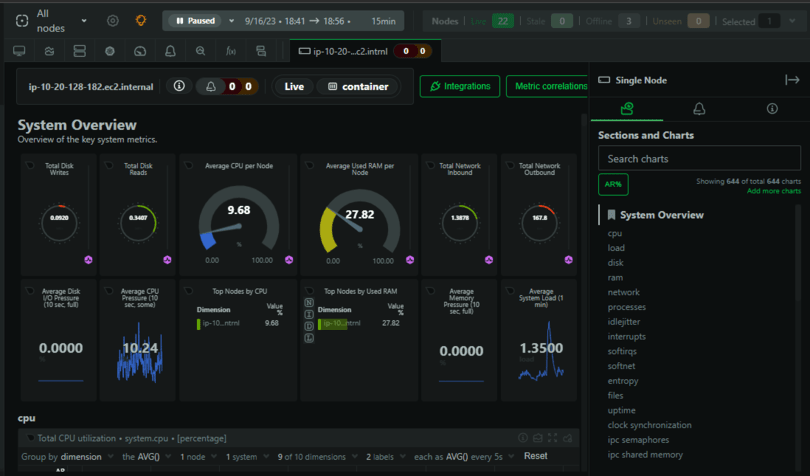
The Netdata Dashboard UI offers a dynamic and intuitive overview of system performance in real-time. It has sections and dynamic charts that capture essential metrics such as CPU usage, memory utilization, disk I/O, network activity, and more.
These metrics provide immediate insights into the health and efficiency of your Civo Kubernetes cluster. You can also zoom, pan, and customize these charts, allowing you to focus on specific timeframes or metrics.
Kubernetes Map
Netdata's Kubernetes Map is a powerful visualization tool that offers a dynamic and intuitive representation of your Kubernetes clusters and their components. It provides a topological view of your Kubernetes infrastructure, illustrating relationships and connections between various entities like nodes, pods, services, and deployments.

The Kubernetes Map helps identify bottlenecks, performance issues, or potential failure points by providing a clear overview of how different components are interconnected. As you scale your Kubernetes deployment or make changes to your configurations, the map adjusts accordingly, giving you immediate insights into the impact of those changes.
Overall, the Kubernetes Map in Netdata offers a visually rich and dynamic representation of your Kubernetes infrastructure, promoting efficient monitoring, troubleshooting, and management of your Kubernetes environment.
Alerts
Alerts in Netdata are automated notifications triggered by defined thresholds or anomalies in system metrics. These notifications notify you of potential issues with your Kubernetes cluster.
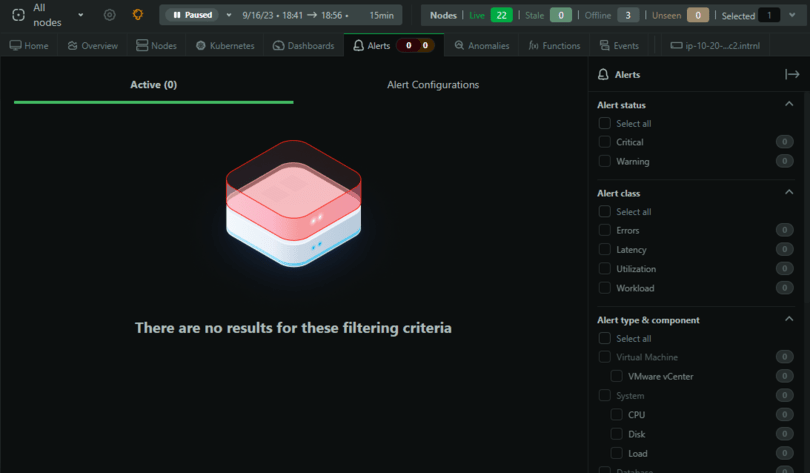
To configure alerts in Netdata, you can define rules based on specific conditions related to metrics, including threshold values, patterns, or statistical anomalies. The configuration can be customized to send alerts via various channels such as email, Slack, webhooks, or even executing user-defined scripts. You have the flexibility to set the severity of alerts, control the notification frequency, and establish dependencies to avoid redundant alerts.

Plugins
Netdata offers a set of plugins designed to monitor specific applications or services running on your Kubernetes cluster. These plugins are tailored to collect and present performance metrics and insights related to the targeted applications. Each plugin is crafted to interface with the application it monitors, extracting valuable data on resource utilization, throughput, response times, and other relevant metrics. These insights are then presented in a visually informative manner within the Netdata Dashboard, enabling you to monitor the health and performance of your applications comprehensively.

Netdata’s plugins cover a broad spectrum of applications, allowing for extensive monitoring capabilities. It has databases like MySQL, and PostgreSQL, web servers like Apache and Nginx, and other specialized applications.
Events
The Events tab in Netdata is a vital feature that provides a clear and concise overview of important events and incidents that have occurred within your Kubernetes cluster. It serves as a timeline, presenting a chronological list of events such as system reboots, critical errors, alerts triggered, or any other noteworthy occurrences. Each event is accompanied by a timestamp and a brief description, enabling a quick understanding of when and what happened.
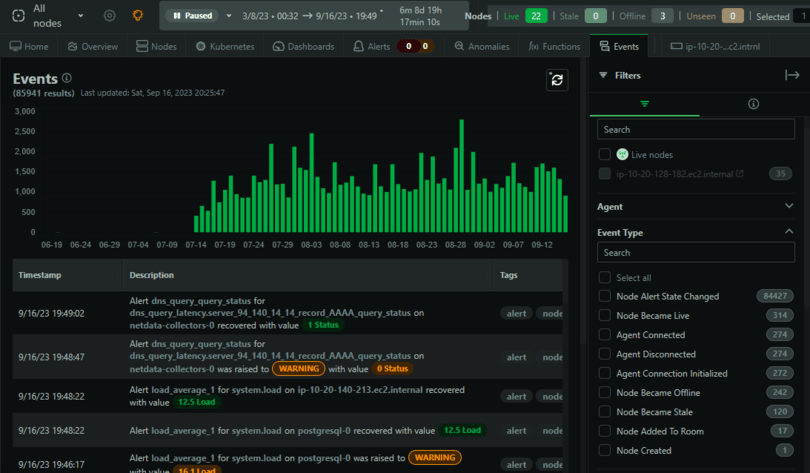
The Events tab includes the ability to add custom annotations. Operators can annotate events with comments or additional information, providing context or actions taken in response to the event.
Benefits of using Netdata
Netdata offers a range of benefits for real-time performance monitoring and health analysis of systems and applications. Here are the key benefits of using Netdata:
| Benefit | Description |
|---|---|
| Real-time Monitoring | Netdata offers transformative real-time monitoring, providing instantaneous system performance insights. This allows for prompt troubleshooting, quick incident responses, and dynamic configuration adjustments. Real-time data also aids in identifying patterns and planning future resources. |
| Comprehensive Metrics | Netdata offers an in-depth view of system performance by collecting various metrics. This enables precise bottleneck identification, root cause analysis, and resource optimization. These metrics are also vital for capacity planning and forecasting future infrastructure needs. |
| Alerts and Notifications | With Netdata, users can set up alerts based on specific thresholds, ensuring immediate detection and reporting of critical events or performance anomalies. This proactive monitoring enhances system availability, reduces MTTR, and optimizes the Kubernetes cluster. |
| Historical Data Analysis | Netdata allows users to delve into historical metrics, offering insights into cluster behavior over time. This aids in diagnosing past incidents, implementing preventive measures, and planning capacity and resources based on past trends. |
| Ease of Installation and Configuration | Netdata boasts a straightforward installation process without the need for complex configurations. This simplicity promotes widespread adoption, especially in dynamic environments where rapid setup is essential. |
| Multi-platform Support | Netdata supports a wide array of operating systems and platforms, ensuring compatibility across heterogeneous environments. This consistent monitoring across diverse landscapes streamlines the process, providing a unified view of the entire infrastructure. |
Summary
Real-time monitoring with Netdata empowers you to gain valuable insights into the performance and health of your Civo Kubernetes cluster. Following the steps outlined in this tutorial, you can set up Netdata, customize dashboards, and proactively manage your cluster's resources. Effective monitoring enhances your ability to ensure the stability and efficiency of your Kubernetes workloads.
Additional resources
If you want to know more about monitoring and the Netdata application, take a look at these resources:


