Introduction
Datadog is a paid monitoring service for today, as it is well optimised for cloud-scale applications. It provides monitoring of physical and virtual machines, databases, Kubernetes clusters, tools, and much more. It follows a Software as a Service approach to provide its data analytics platform. Datadog is useful for those who have large scale deployments. There are also some well-known free solutions like Grafana and Prometheus, but Datadog excels due to its UI, ease of setup and the awesome logging and alerting features out of the box.
Datadog is easy to use and provides great metrics visualization and log management. This tutorial will cover all steps how you can integrate Datadog with your Civo Kubernetes cluster.

Prerequisites
- You need to have a running Civo Kubernetes cluster to complete this tutorial. If you do not yet have an account, you can sign up here. Once you have a cluster running, make sure you have the KUBECONFIG set and pointing to this cluster. For more detail, refer to "your cluster kubeconfig" here.
- You will also need a Datadog account. If you do not have an account, there is a free 14 day trial available.
- You will also need Helm to add Datadog to your cluster. If you do not have it preinstalled you can find installation instructions here.
Let us get started
We would start by connecting to our Civo cluster and run kubectl get nodes just to check that we are in fact connected and all our nodes are ready. By running this command, we will see something like the image below.

Then we need to download Datadog's default values yaml file and save it as datadog-values.yaml. This can be done via the command curl https://raw.githubusercontent.com/DataDog/helm-charts/master/charts/datadog/values.yaml > datadog-values.yaml, which will save the file in our current directory.

If you want to manage logs with Datadog, you need to edit the datadog-values.yaml file. Locate the logs: section and set enabled: false to enabled: true. As you are already here, you can also enable collection of logs from all of your containers by changing containerCollectAll: false to containerCollectAll: true. By doing this, the Datadog agent will be able to access your logs and upload them to their server. The log retention depends on your contract: for free/basic account it's 1 day, and for other accounts it's 15 days.

Now comes the deployment part where we will need Helm.
Next step would be adding the Datadog helm repository. It can be done by helm repo add datadog https://helm.datadoghq.com.
Now we have to add the stable repository to gain access to the chart kube-state-metrics which we'll need as well. You can do this by running helm repo add stable https://charts.helm.sh/stable.
Fetching newly added charts will be next step: helm repo update.
Now we have to run helm install to install the agent to our cluster. For this, you will need your Datadog API key, which you will find in your Datadog account, under Dashboard -> Integration -> API keys. Use it in the command below:
helm install <DEPLOYMENT_POD> -f datadog-values.yaml --set datadog.site='datadoghq.com' --set datadog.apiKey=xxxxxxxxxxxxxxxxxxxxxxxxxxxxxxxxx datadog/datadog
You should see something like the output below:

This will create the necessary pods on all nodes and resources. After completing this you will be able to see your nodes in Datadog Dashboard.

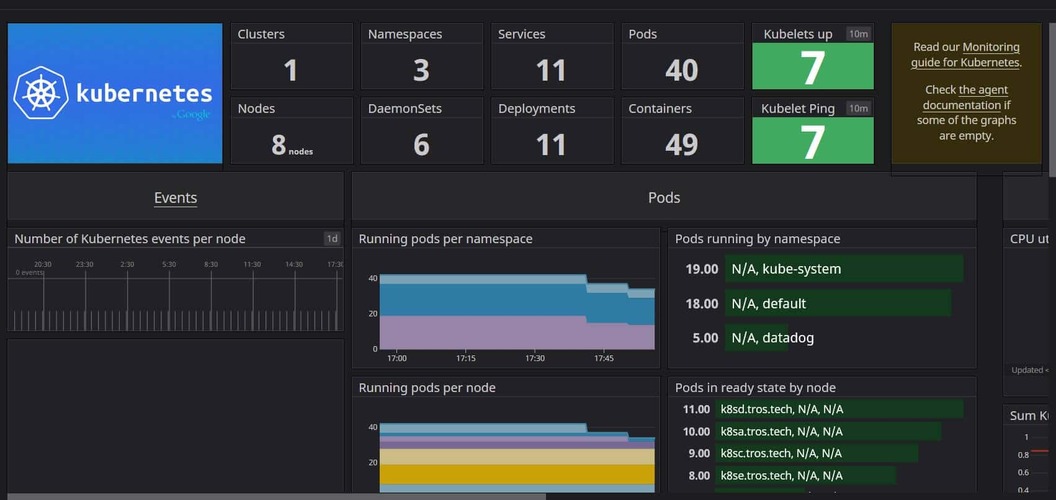
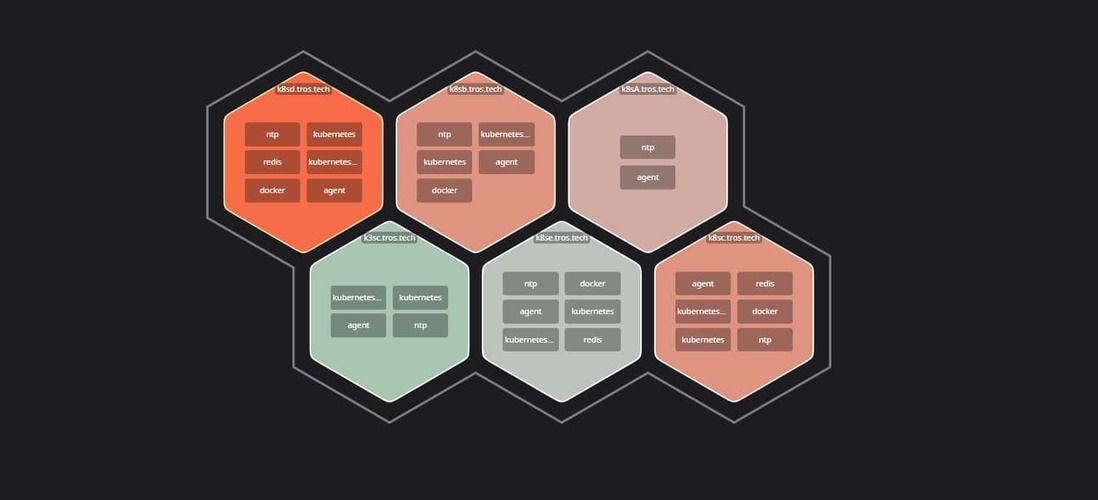
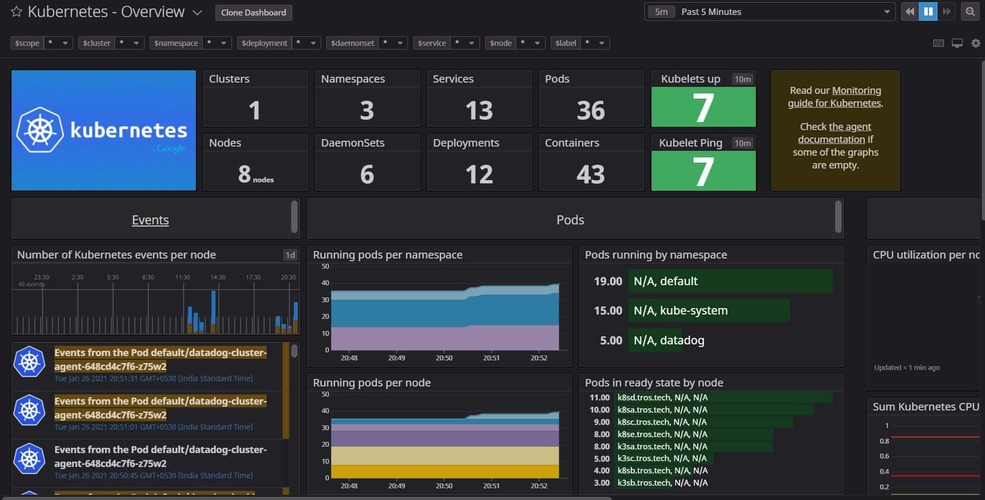
Let us now look at the Datadog dashboard

Datadog allows us to visualize data in many ways. As below I am showing Kubernetes-overview

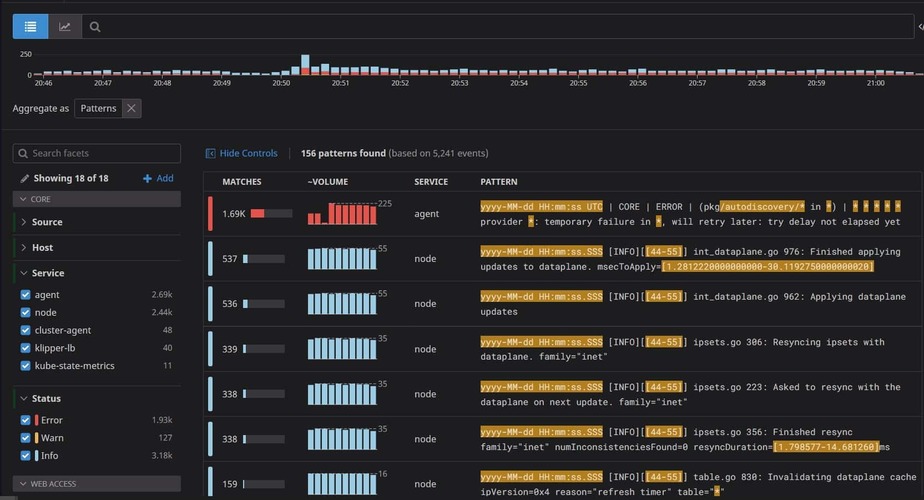
Now if we go to the log section, we will find many ways with which we can manage logs such as Search, Analytics, Patterns, Live tail. You can also generate metrics if you define custom rules.

Here you can see logs aggregated on basis of patterns.
Wrapping up
By following this guide, you will have installed Datadog-agent on your cluster. By doing this you can easily see metrics and manage logs, which are automatically fed through to the Datadog platform.
Some tips
if your dashboard on Datadog shows an error stating unable to detect the kubelet URL automatically and requires kubelet_tls_verify = false this is due to running a cluster without proper configuration, such as in a home lab context. This can be easily solved by kubectl edit ds datadog and adding the field DD_KUBELET_TLS_VERIFY=false to it, as shown in the image below.


