Kubernetes is, without doubt, one of the fastest-growing DevOps frameworks, owing largely to its flexibility and scalability. However, these benefits add complexity to other lifecycle tasks such as monitoring. In this guide, you will learn some best Kubernetes monitoring best practices that you can use to get the most out of your Kubernetes clusters.
To set the context, Kubernetes is one of the most popular container orchestration platforms in today’s world. Kubernetes helps you scale and ship containerized applications. It also helps you manage huge swarms of containers with ease and scale according to your app’s user traffic.
With such a complex and advanced deployment mechanism, keeping an eye on how things are going becomes extremely crucial. Unlike two web servers and a load balancer, Kubernetes deployment provision hundreds, if not thousands, of pods and containers. These are created and destroyed very swiftly based on app requirements. Apart from managing basic metrics such as CPU, memory, disk I/O, etc., you also need to take care of K8s-specific metrics such as the number of active pods, count of failing or dead pods, container CPU usage, network usage, and more.
Why monitor a Kubernetes cluster?
Monitoring refers to logging the data related to a system's resource consumption and performance output. In the case of Kubernetes, monitoring aims to ensure that your clusters are performing to the best of their capacities and the end-users are facing a smooth experience while using your product.
An effectively executed K8s monitoring strategy can give you a lot of benefits. You gain insights into improper container management, allocate resources between clusters more efficiently, and ensure that errors that occur in your infrastructure are picked up and dealt with on time. Without proper monitoring measures in place, you can lose out on a lot of customers and revenue just by being unaware of what’s going on in your app.
At the same time, you also need to understand the need for deep observability over monitoring. Monitoring is just collecting performance data from your app and resolving issues that occur in real-time. On the other hand, observability focuses on correlating this data and observing trends that hold answers to bigger problems within your infrastructure. Observability tools provide you with a more detailed analysis of what’s wrong in your app and how it might snowball into bigger problems in the future.
7 Kubernetes Monitoring Best Practices
Here are seven useful tips to keep in mind when monitoring a deployed Kubernetes cluster.
1. Identify the right metrics to monitor
Before beginning to monitor your Kubernetes environment, you need to identify the metrics you intend to monitor. Without a proper list of target metrics, you will not be able to gain the desired results from a monitoring setup.
Kubernetes.io suggests some key metrics that you should track closely to know what’s going on with your K8s clusters. They are
- Active pods
- Resource metrics such as CPU, memory consumption, Disk I/O usage, etc
- Container native metrics
- Application-specific metrics
2. Use labels and tags extensively
Since Kubernetes manages container orchestration on its own, the only way you have to interact with your pods in containers is by giving them a label or a tag. Tags and labels are descriptors used to identify different entities inside your deployments.
You can attach a tag or a label to any active entity in your K8s cluster (generally the application, its container, or its pods). For instance, you can attach application-specific tags to your containers and filter them out based on which application they belong to. Or, you could consider attaching location-specific tags to your resources to filter them based on the zones that they belong to.
No matter how you choose to take advantage of labels and tags, you should keep in mind to formulate & document the strategy of naming your labels. This will help you not only keep your label uniform throughout your infrastructure but will also help you to analyze it and improve your naming styles.
3. Aim for observability over monitoring
When planning a strategy for monitoring your containers, always go for deep visibility. Since containers are barebone structures that wrap your application with essential kernels and other environment details, you need to take measures that go beyond basic CPU, memory, and other similar metrics. You should focus on gathering finer data at the kernel level. This could include information about running processes, file access traffic, network traffic, and more.
4. Capture historical data to predict future performance
Monitoring helps you to look into how your system has been performing and suggest ways to make it perform even better. However, you can make it more than that. If you choose to retain historical data about your Kubernetes clusters’ performance, you can make use of this data dump to run analyses and find key trends. You can leverage these trends to gain insights into when your system might run into issues in the future.
Even if you do not wish to go so big on your monitoring activities to try to predict your clusters’ future performance, you can still make good use of historical performance data. Since clusters create and destroy containers on a regular basis, even small strips of time can yield a huge heap of useful data. It can come in handy when running deep root cause analyses in the future as well.
5. Pay attention to the control plane
You can assume the Kubernetes control plane to be the brains of your Kubernetes operations. It is responsible for managing everything in and around your cluster. This means that most of the activities that occur in your Kubernetes clusters are routed through the control plane. Monitoring this central gateway will give you insights into unnoticed latencies and errors.
6. Prefer out-of-the-box dashboards for easier setup
Most monitoring solutions provide you the option to get started using one of their pre-built dashboards. While it might not seem like the best option keeping flexibility and customization in mind, out-of-the-box dashboards are usually easier to set up and provide you with a set of highly useful views at once. If you are new to monitoring and analysis, out-of-the-box dashboards will not only reduce the time spent in creating the dashboard, it will also save you from having to learn to design dashboards altogether as these often involve specialized languages and a learning curve.
7. Keep end user experience in mind
Most users tend to forget this best practice when implementing a Kubernetes monitoring setup—focus on the end-user experience. One of your monitoring goals should be to provide a good end-user experience, and be aware if this isn’t being met. To achieve this, you can consider implementing other non-conventional forms of monitoring, such as end-to-end monitoring or HTTP monitoring. These measures help you view your app as an end-user and understand the speed, availability, and ease of use that they receive.
The importance of Kubernetes alerting
Alerts are notifications sent out when your metrics exceed a certain, pre-set threshold. In most cases, alerts indicate something wrong with your system that needs immediate attention. In other cases, you could also set up alerts for routine system checks and reports. All in all, alerts help you to stay in touch with your K8s monitoring data in real-time.
You can set up alerts based on thresholds on your metrics. You can configure these alerts to be sent via different mediums (push messages, emails, pagers, etc.) and can control these are sent to based on what the alert is about. You can formulate a full-fledged escalation strategy using alerts to call in different levels of support teams based on the requirements of the issue.
However, it is important that you take care not to overdo alerts. For people on the receiving end, alerts can get overwhelming quite easily. Some ways to ensure that your teammates do not suffer from alert fatigue are:
- Correlate issues and reduce the number of duplicate alerts
- Limit the time during which your team will receive alerts
- Prefer not sending out alerts that are not time-sensitive outside of office working hours
- Make sure alerts carry adequate contextual information and are actionable
Kubernetes monitoring open source tools & solutions
Given below are some popular tools used to monitor Kubernetes. There are both paid and open-source alternatives on the list. While paid tools provide you access to premium features and faster support, open-source solutions are easily accessible and offer a large community to help resolve your issues. When beginning with monitoring in your Kubernetes infrastructure, it is better to try things out with an open-source tool before settling down with a paid one.
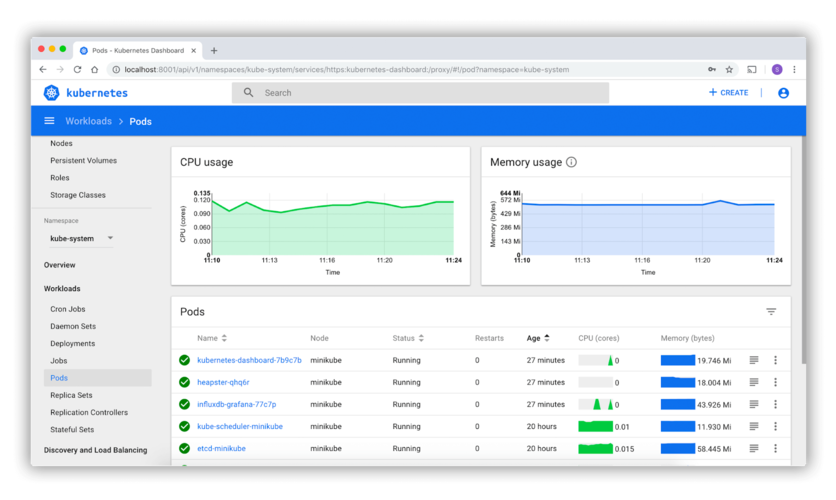
Kubernetes Dashboard

Image Source: Kubernetes.io
The Kubernetes dashboard is the default out-of-the-box tool for monitoring and analyzing Kubernetes performance. It is an open-source tool and enables you to view and handle all aspects of monitoring your Kubernetes cluster.
You can easily monitor metrics related to applications, deployments, resource utilization, and more. The dashboard enables you to make changes to resource allocations and update their state in a cluster when needed. Since it is open-source, you can get started with it in an instant. Here is beginner-friendly tutorial on ho to Deploy Kubernetes Dashboard through Civo Marketplace to help you get started easily.
Prometheus and Grafana

Image Source: Prometheus.io
Prometheus and Grafana have been the choice of a majority of users for a long time. Prometheus has grown to become the de facto standard for Kubernetes monitoring. Prometheus offers a multi-dimensional data model, a dedicated querying language by the name PromQL, built-in alerting, and a large community. Coupled with Grafana’s powerful alerting, annotations, visualization, and dashboarding abilities, this duo makes for a strong monitoring setup.
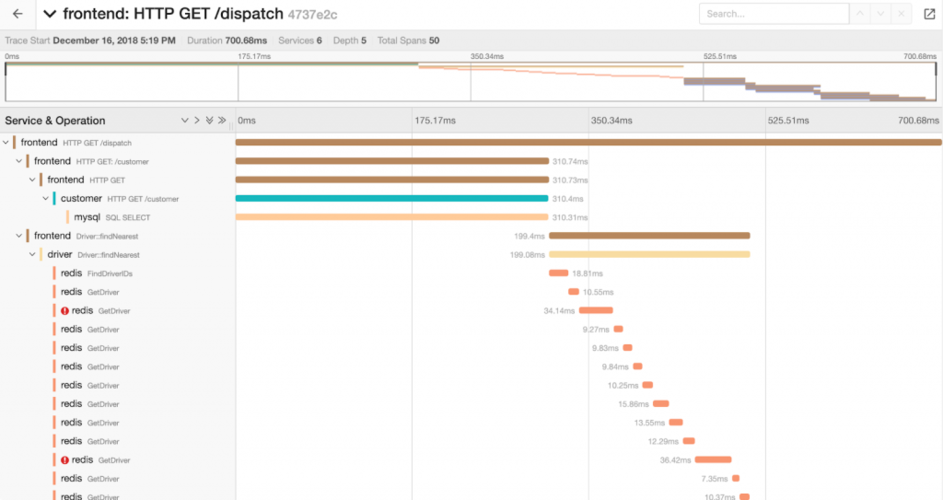
Jaeger

Image Source: Jaeger
Jaeger is an open-source monitoring tool developed by Uber. It enables users to try out root cause analysis, optimize app performance, and monitor distributed transactions. Jaeger relies on tracing to help you monitor and troubleshoot complex Kubernetes clusters. Jaeger is popular due to a wide range of instrumentation options, an easy deployment process, and a slick user interface.
Weave Scope

Image Source: GitHub
Weave Scope is an open-source Kubernetes monitoring tool. It is similar to kube-ops-view, but it adds useful features like a unified interface for managing containers and running diagnostics on them, better UI, and more.
Weave Scope is an efficient tool for gaining insights into your app’s deployment, from the app to the infrastructure. Another reason Weave Scope is popular is due to its zero-configuration setup process.
Final Thoughts
Kubernetes is, without doubt, one of the leading container orchestration technologies in the market. However, it is not among the simplest ones to monitor. In this guide, we showed you some of the best practices and tools you can use to set up an effective Kubernetes monitoring strategy. Alerting is an essential part of monitoring, and you should ensure that you plan and implement a robust alerting strategy alongside your monitoring setup.


