Kubernetes is a robust and powerful orchestrator for containerized applications, but it is also complex and sometimes difficult to get to grips with. As you work with Kubernetes, having an efficient and user-friendly tool to manage your clusters is essential. Enter K9s: a powerful terminal-based tool designed to make Kubernetes cluster management easier and more approachable.
This article will discuss K9s, its key features, and how it can significantly improve your Kubernetes cluster management experience. We will cover the basics of navigating through the tool, customizing its interface, and extending its functionality with plugins. By the end of this article, you'll have a solid understanding of how K9s can help you become more efficient and effective in managing your Kubernetes clusters and the resources running in them.
While you can achieve all the functions that K9s gives you through kubectl commands, some users will find the visual layout presented by K9s much more approachable. Handily, you also don't have to remember the order of arguments and which arguments a particular kubectl command requires!
Prerequisites
Before you dive into this K9s guide, make sure you've completed the following steps:
- Civo account
- Create and configure your first Kubernetes cluster
- After setting up your cluster, ensure you have your kubeconfig file saved, as you'll need it to follow along with this guide.
Note: This guide focuses on the day-to-day usage and administration of Kubernetes clusters using K9s. If you're preparing for the Certified Kubernetes Administrator (CKA) exam, you'll need to have a strong understanding of kubectl.
What is K9s?
K9s is a command-line based utility for managing and monitoring Kubernetes clusters. It provides a visual interface allowing users to view and manage their Kubernetes resources, such as pods, deployments, and services, in a more intuitive and user-friendly way than using the kubectl command-line tool. K9s also offer features such as resource filtering, inline editing, and resource management and deployment tools. It is designed to be lightweight, making it a useful tool for developers and administrators who work with Kubernetes clusters on a daily basis.
Key features of K9s
K9s also offer features such as:
- Resource filtering: Easily filter and find specific resources within your Kubernetes cluster.
- Inline editing: Modify resources directly within K9s, streamlining your workflow.
- Comprehensive resource management and deployment tools: Efficiently manage and deploy resources with an extensive set of tools.
- Lightweight design: K9s is designed to be fast and easy to use, making it an ideal choice for daily Kubernetes cluster interactions.
- User-friendly: K9s offers a straightforward and intuitive interface, simplifying Kubernetes management for developers and administrators.
How to install K9s
K9s is an open-source software and is available for various operating systems. You can find installation instructions on the K9s’s official repository. K9s is also accessible through package managers.
On Mac OS, you can install K9s with brew:
brew install k9s
On Windows, either via scoop or chocolatey:
scoop install k9s
choco install k9s
On Linux, you may find your package manager contains K9s. If not, you can always get the latest binaries from the K9s repository releases page.
K9s usage
K9s runs in your terminal, and if you have installed it according to the instructions for your operating system, you should be able to start it with the k9s command. It will by default read your current KUBECONFIG, which in turn is by default read from $HOME/.kube/config. If your Civo cluster configuration is saved there, you should see it be loaded when you start K9s.
If you ever get lost in K9s, you can use ? on any screen to get a help screen. And if you want to close k9s, the easiest way to do that is to use control-c to kill the process and return back to your shell.
Viewing resources
If you are familiar with vim commands, you will be right at home with K9s. The way to change what you are seeing is by prefixing the type of resource with a colon. So, in order to view pods in your cluster once you are running K9s, you would type :pods and press enter. To switch to viewing nodes, type in :node and press enter. You can see suggestions populated in the command box as you type, so you can take advantage of tab-completion and save on keystrokes. So, to view all the namespaces in your cluster you might only have to type in:
:na <tab> <enter>
Searching
If you have a lot of resources of a particular type in a cluster, you can quickly search through them using the / command. If, for example, you wanted to filter all namespaces you retrieved in the previous section down to just the ones that contain kube in their name, you would type:
/kube <enter>
You might get something like this:

Obviously, this is an example with only a few potential items to sift through, but if you had hundreds of namespaces or custom resources, it would be a lifesaver. This saves you from having to chain grep commands into kubectl output!
Navigating Kubernetes resources
Once again, if you are familiar with vim you will be able to move about the resources using j for down and k for up. Handily for those of us who never got the hang of vim navigation, the arrow keys work just as well!
You can select the resource you want and press d to describe it. In the image below, I am viewing the description of a node in my cluster, which I found with the following commands:
:node
kkd
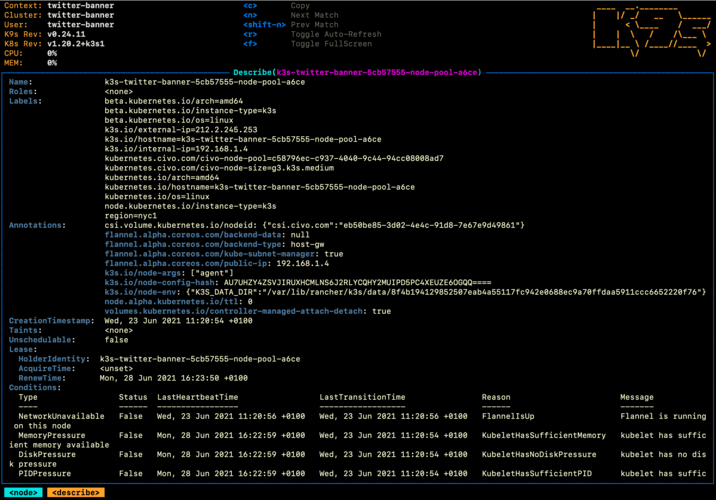
That's quite a lot of keystrokes saved compared to kubectl describe node <nodename> and that's assuming you have the node name handy! You may have to first get it with kubectl get nodes -o=name.
Logs of Kubernetes resources with K9s
You can view logs of any pod, job or other Kubernetes resource using the l command when you have that resource selected. However, what about viewing past events, if a resource has been replaced by a new instance of itself that is now writing its own logs? K9s allows you to view previous logs for that resource with the p command which is incredibly handy for tracing errors or other issues.
If you are viewing logs and want to see exactly when an event occurred, you can use t to automatically insert timestamps:

Operations on Kubernetes resources with K9s
With K9s you can also edit configurations on the fly. If you press e on any given resource you will be presented with your default editor (likely vim if you have not specified another) to edit the configuration yaml of that particular pod, deployment, or other resource.
Obviously, if you end up editing these configurations, they will affect your cluster immediately but may be overwritten by subsequent CI/CD deployments if you use them.
You can perform node-level operations on K9s as well. For example, you could cordon a node, or even drain it so that you can remove it from your pool or perform other maintenance on it.
If you have a pod that is misbehaving, you can delete it using K9s too. Navigate to it in the :pods view and press control-d. You will be prompted to confirm the deletion of the pod:
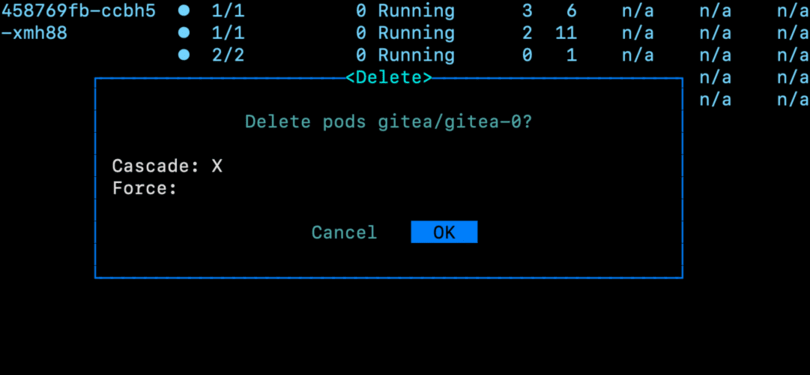
And as soon as you do, the Kubernetes cluster API will schedule another pod to take its place:

You can also configure port-forwarding from a specific pod by using shift-f and picking a local port, like 3000. You can then navigate to localhost:3000 and view the resource.
Alternatively, you can even open up a shell into a running pod if it supports it! Select the pod you want and press s. This is the equivalent of running kubectl exec --stdin --tty <podname> -- /bin/bash. Again, a much quicker way of doing things!
In my case, I picked the main Gitea pod that had been created when I selected it from the Kubernetes marketplace. Voila:
<<K9s-Shell>> Pod: gitea/gitea-0 | Container: gitea
bash-5.0# ls
app    bin    data   dev    etc    home   lib    media  mnt    opt    proc   root   run    sbin   srv    sys    tmp    usr    var
bash-5.0#
To exit from the shell, you can run exit which takes you back to the K9s screen.
K9s monitoring tools
K9s has an interesting set of monitoring tools aside from a periodic polling of the selected resource (pod, node, etc) that you get on the main screen. One of the most interesting visualizations is the :pulses mode. Give it a try:
:pulses
You should see live-updating, color-coded graphs of the main aspects of your cluster:
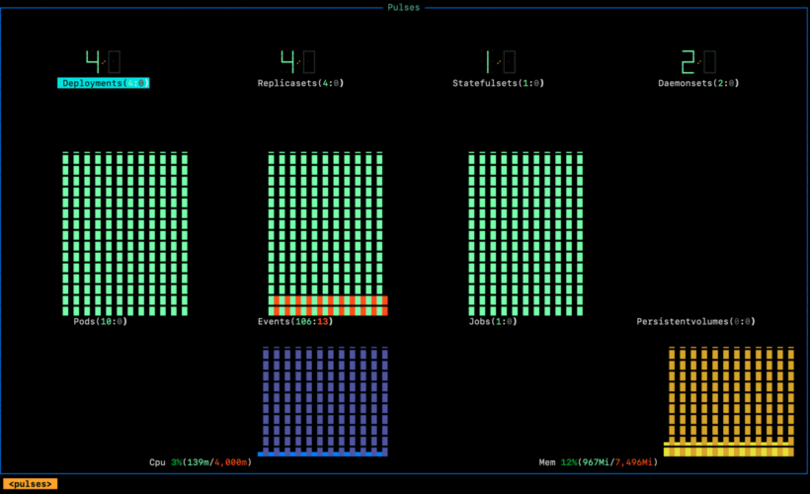
You can navigate to drill down to each pulse shown by using Tab or selecting the number corresponding to the particular resource in the K9s top bar. In this image, I've scrolled down to Events to look at the 13 warnings, pressed enter and scrolled down the list:
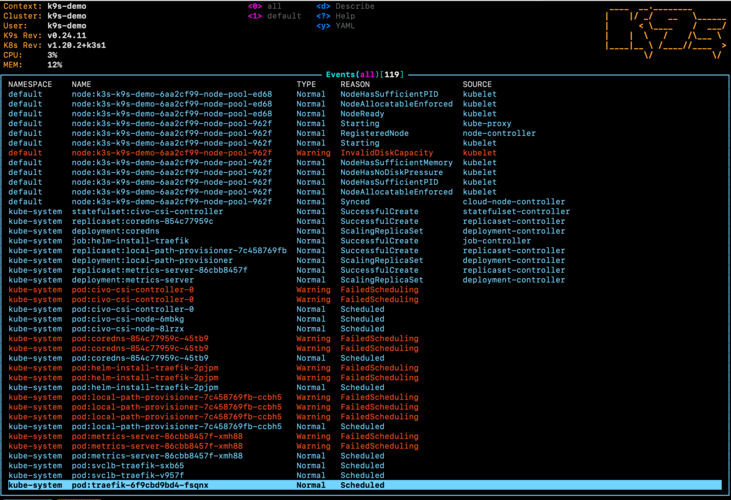
If you were to see event warnings such as this, you could then scroll to the specific one you wanted to view, and view information about it by pressing enter or d to describe it.
In this case, they are expected warnings, as the eventually consistent nature of Kubernetes means the Kubernetes API has to re-try certain events until they succeed, as they may depend on other components running. This was a cluster that was in the process of starting, so the events were all happening at once.
You can back out of any view by pressing Esc until you are at the screen you wish to see again.
Advanced K9s usage
K9s Plugins
K9s has a support for plugins, meaning you can create your own, or choose from community-contributed plugins that help extend the functionality of K9s by adding shortcuts to complex commands. Some interesting plugins include:
get-all
This plugin allows you to instantly get all resources in a given namespace by leveraging the krew get-all command. Once installed, pressing g in any view will display all components and resources in that namespace.
Note that you will need to install the krew package and the ketall module to be able to use this plugin.
log-full
A plugin to add a shortcut (shift-l) to view all logs for a given resource, rather than the default logs view. Useful when you need to be able to trace all events of a particular pod for debugging.
K9s bundles the Popeye Kubernetes sanitizing tool, which you can use to evaluate your cluster's configuration against best practices. To access Popeye scanning, use the :popeye command. This will open up a scan summary page giving you an overall score and the components Popeye has analyzed:

You can drill down into any component, such as daemonsets, to view the reasons for the results:
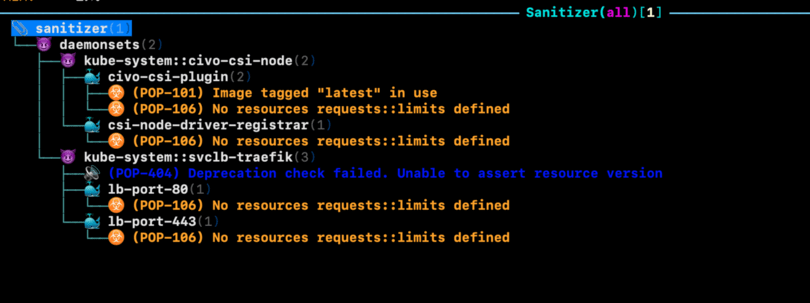
If you want to mitigate any configuration issues detected by the Popeye scan, you can look up the error message. For example, in the above screenshot, the "(POP-101) Image tagged "latest" in use" message relates to the fact that the latest image tag is not immutable, which might be something you want to avoid.
To address this issue, you might consider using a versioned tag instead of the latest, ensuring that the image used is always the same. Alternatively, you could use a tool like Anchore to perform a more detailed analysis of your images and catch issues like these.
Overall, using Popeye and other K9s plugins can help you ensure that your Kubernetes clusters are properly configured, secure, and efficient. Using these tools, you can simplify your workflows and avoid common pitfalls in your Kubernetes deployments.
K9s Customization
K9s also offers a wide range of customization options that enable users to tailor the tool to their preferences and requirements. Some of the primary customization features include:
- Configuration file: K9s stores its configuration in a YAML file named k9s.yml, usually located in the ~/.k9s directory. This file contains settings such as the preferred namespace, view, and log tail lines. You can modify these settings to change the default behavior of K9s.
- Skins: K9s supports skinning, which allows you to change the appearance of the interface by modifying colors, styles, and other visual elements. To create a custom skin, you can create a YAML file with the desired styling attributes and save it as ~/.k9s/skin.yml. K9s will load the skin configuration on startup. You can even set a cluster-specific skin to visually distinguish the context you’re working in.
- Aliases: Just like with your terminal shell, you can create aliases in K9s to speed up common commands you run.
To create aliases for K9s, you need to create a file in the
.k9s/directory. By default, this is under your home directory, so you can navigate to it by runningcd $HOME/.k9s.When you are in the correct directory, create a file called
alias.ymland edit it with your favorite text editor. The format of alias definitions is in the form ofalias: group/version/resource. For example, if you want to make an aliasdepto view all deployments, you would need to define it inalias.ymlas:alias: dep: apps/v1/deploymentsNote that the file must start with
alias:at the top, with your alias definitions nested underneath, each on their line.Now, when you start K9s, you can type in
:dep <enter>from the main screen and see your deployments. Neat!As always, refer to the official documentation for more detail on the structure and usage of the alias file.
To get started with customizing K9s, you can refer to the official documentation, which provides more detailed information and examples of configuration options: https://k9scli.io/topics/config/
Wrapping up
For getting information at-a-glance, quickly and at your fingertips in your terminal, K9s is an invaluable tool. The fact that you can view custom resource definitions alongside any other Kubernetes cluster objects means that K9s adapts to your cluster and its configuration.
You can rapidly perform operations on your cluster without convoluted kubectl commands that chain multiple terminal commands to get the output you want. In fact, every kubectl command you can target your cluster with has a corresponding K9s method, which you can make aliases for at your leisure. Additionally, K9s brings its own observability and analysis features like the Pulse and Popeye views, which help you keep an eye on your cluster overall.
K9s also offers a wide range of plugins that can help extend its functionality and integrate with various tools and services, such as live log monitoring, cleaning up Kubernetes manifests, visualizing object hierarchies, and interacting with the NGINX Ingress controller. You can even customize K9s to fit your own workflows by creating custom aliases, shortcuts, and views.
We find K9s absolutely worth getting familiar with, and look forward to new features that will make using it even better. If you have used K9s and think we haven't covered a feature that should have been, give me a shout on Twitter and I will update this guide and give you credit for it!
Alternatively, if you have a favorite Kubernetes management tool that runs in the console, let me know about it! I love CLI tools and am always keen to try out new ones. You can find me on Twitter as above, or on the Civo community Slack.


