As a developer, it can become challenging to manage Kubernetes and develop applications simultaneously. That’s why we put together this guide to show you how the Kubernetes Dashboard can help developers overcome this problem and get an overview of the cluster and its workloads. From this, developers can focus more on application development while stressing less on cluster management.
What is a Kubernetes Dashboard?
Deploying containerized applications into Kubernetes clusters can be done via a web-based user interface known as a Kubernetes Dashboard. This helps provide a detailed overview of a Kubernetes cluster and its different workloads allowing developers to troubleshoot containerized applications and manage cluster resources.
Kubernetes Dashboards can create and modify individual resources such as deployments and jobs. This allows users to scale deployments, create and restart pods, deploy applications, and initiate a rolling update.
Why should you use Kubernetes Dashboards?
1. Useful engineering tool
Kubernetes Dashboard provides an overview of the state of resources in your cluster and information about errors that have occurred. DevOps engineers, developers, and SREs find this useful as it shows them what is happening inside their cluster.
2. Increased developer productivity
The Kubernetes Dashboard helps increase developer productivity by reducing the work required to manage a cluster, therefore, allowing more time to be spent on the development of the application.
3. Scale cluster resources
They help users scale cluster resources such as pods and nodes directly from the user interface. This helps to make the task simpler and less time-consuming.
4. Help in troubleshooting
As Kubernetes Dashboards provides you with logs, metrics, and error reports, you can additional help in troubleshooting if something goes wrong with your cluster.
5. Managing a cluster
Kubernetes Dashboard helps you manage your cluster by allowing you to deploy new applications through deploy wizards, initiate rolling updates, and restart pods. This serves as an advantage to someone who wants to bypass the command line interface (CLI) for doing such tasks.
What are the different Kubernetes Dashboards?
1. Kubernetes Dashboard
The standard Kubernetes Dashboard, present in the Kubernetes repository, is used to complete tasks such as providing the CPU and memory usage of different workloads derived from the metrics server. In addition, you can gather information on areas such as the Jobs, daemon sets, deployments, and pods. If you click on a pod, you will get the resource information, the metadata associated with the pod, the conditions present in the pod, and the information about the replica set, which controls that pod. Similarly, by clicking on the services tab, you can look at all services that are running and edit them as a JSON/YAML.

Source: Kubernetes.io
How to install Kubernetes Dashboard
The Dashboard is located inside the cluster, meaning that the user interface (UI) is not deployed by default. Running the following command will deploy the Dashboard UI:
kubectl apply -f https://raw.githubusercontent.com/kubernetes/dashboard/v2.6.1/aio/deploy/recommended.yaml
2. Datadog Dashboard
One cannot ignore the Datadog Dashboard when it comes to monitoring Kubernetes clusters. The Datadog Dashboard helps you view and audit logs generated from Kubernetes clusters. One of the main advantages of using this Dashboard is the ability to have better visibility of the control plane. This is because deploying Datadog into a cluster helps it integrate with the individual components of the cluster’s control plane and as a result, you automatically get the metrics of these components and monitor the overall health of your cluster. Datadog Dashboard also helps you monitor Kubernetes resources by creating tags and labels.
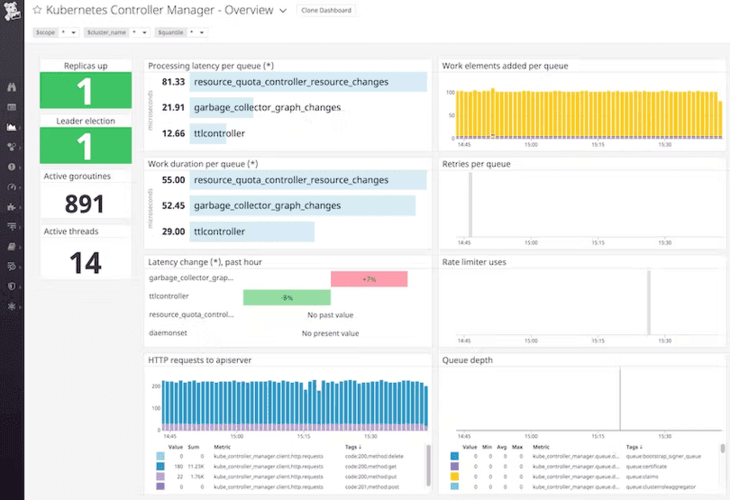
Source: Official Datadog blog
How to install Datadog Dashboard
To get started with the Datadog Dashboard by signing up from their official website. You’ll also need to install the Datadog agent which is the open-source software responsible for collecting and reporting metrics, traces, and logs from the nodes. Follow the step-by-step tutorial to install one from here.
3. Skooner Dashboard
Understanding and managing a Kubernetes cluster can be simplified using the Skooner Kubernetes Dashboard. The most important feature of Skooner is that it has the ability to show fast and live metrics as it automatically refreshes and updates. Skooner possesses a fast, lightweight, and responsive user interface, regardless of the device it is being viewed on. This Dashboard helps you monitor the health of your cluster by providing real-time charts that help in tracking poorly performant resources.
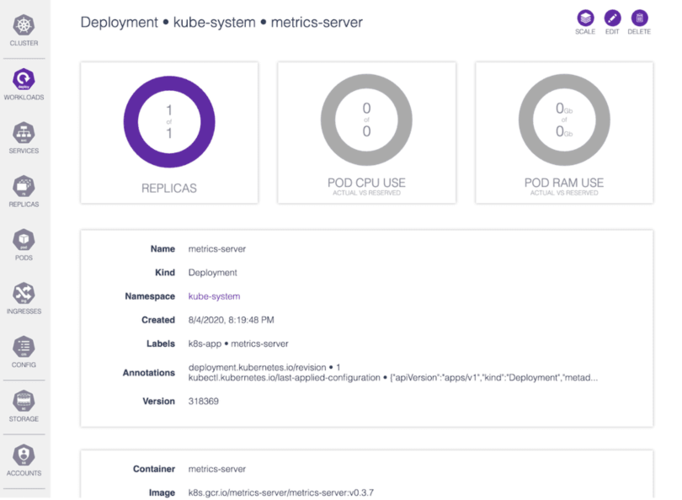
Source: Official Skooner website
How to install Skooner
As this particular Dashboard is from the server side, it needs to be applied in a cluster. To install Skooner, you will need to follow the required steps from the official website found here.
4. Lens Dashboard
Lens is a desktop application with a range of features making it heavy in size. A key feature includes easy multi-cluster management, as Lens lists different clusters in boxes (similar to slack channels), allowing for an interactive experience for users managing clusters. Another important feature of Lens is the ability to install metrics. Other dashboards don’t have out-of-the-box metrics installation, but with Lens, you will be able to install metrics such as probabilities operator and kube-state-metrics.
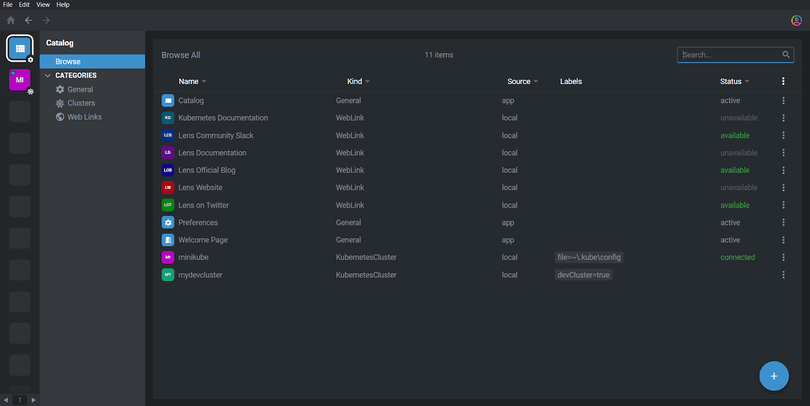
How to install Lens
In order to download the Lens Integrated Development Environment (IDE), you can refer to the official website for information on the different operating systems.
5. Octant Dashboard
Octant gives you the Kubernetes Dashboard view on the client side of things, helping you observe the relationship between objects within a cluster with the help of its resource viewer. With Octant, you also have the advantage of a label filter. This is highly advantageous if you have a lot of objects in a namespace as you can filter the objects with labels. Another interesting feature of Octant is that you can access plugin support from tools like Helm and Starboard by downloading the plugin tar file and putting it inside the plugin directory.
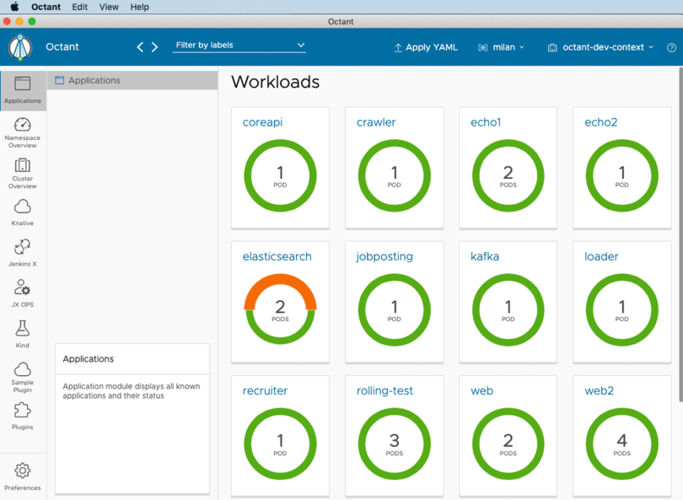
Source: Official Oktant v0.17 release doc
How to install Octant
To install Octant on your machine, you have to download the binary. The binary is available for free on GitHub, and you can download the latest version from here. The binary is then installed locally and immediately exposes a web-based UI.
6. Headlamp Dashboard
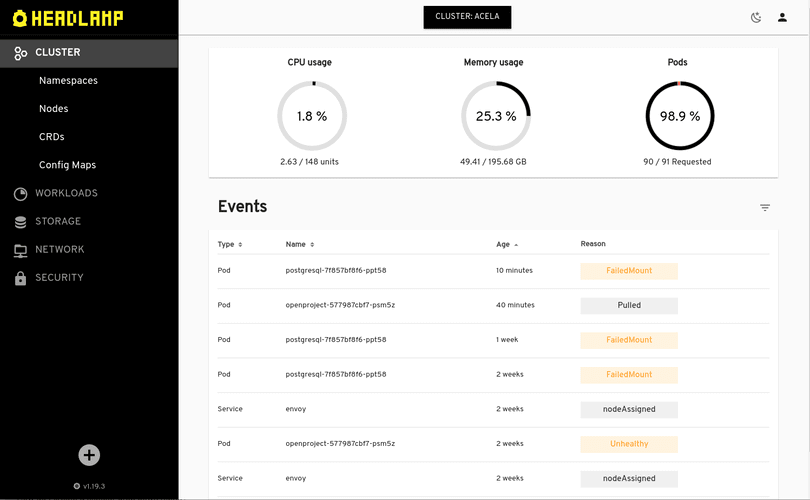
Headlamp is a Kubernetes web user interface developed by Kinvolk. This Dashboard provides a basic Kubernetes UI associated with plugin support, meaning it can be customized according to your needs by downloading plugins. Open ID Connect is available with Headlamp, along with the ability to view logs, exec into pods, and edit resources. Overall, the Dashboard is highly interactive as it can perform read and write operations based on permissions.
How to install Headlamp
You can use the Headlamp dashboard as an in-cluster deployment, or you can use it locally by downloading and installing the desktop application. The in-cluster installation steps can be found here. You can also follow the steps for desktop application installation for different operating systems from the official docs.
Summary
With a range of options available, the Kubernetes Dashboard is a useful tool which possesses a lot of advantages when it comes to increasing your productivity while managing clusters. Whilst this article discussed 6 of the most commonly used Kubernetes Dashboards, you can view more in our video from Saiyam Pathak, Director of Technical Evangelism, and get a better understanding by trying them out from hands-on demos: